The Manley Macro Memo
Wall Street believes the Fed will engineer a "soft landing." Is it probable?
If you enjoy our work, please hit the like button and share our memo with others! Thanks, JLM
SUMMARY
Stocks and bonds performed poorly in 2022 because the Fed aggressively raised interest rates to slow economic growth and fight inflation, which reached a forty-year high. The sharply higher interest rates pushed down the valuations of all financial asset classes. In fact, stocks and bonds declined for only the 5th time in the last 100 years.
The stock market has started 2023 on a solid note. The S&P 500 and Nasdaq 100 have appreciated by 4.6% and 8.0%, respectively. The S&P 500 has rallied 15% off its October low, which is consistent with previous mid-term election rallies. The strong mid-term rally – which we wrote extensively about this summer and early fall – is due to technical factors (oversold market, passive 401k flows, corporate buybacks, and systematic trend-following strategies) and not a change in the fundamentals.
Last year, leading economic indicators showed that the economy was strong and inflation would be a problem. Unfortunately, the Fed ignored these indicators and continued its unprecedented monetary stimulus, which created asset bubbles, and drove inflation to a 40-year high. We believe that the Fed is making another monetary mistake by focusing on inflation and employment measures – which are lagging economic indicators – and again ignoring the leading economic indicators that have sharply deteriorated and point to a mild recession this year.
Despite a 27.5% drop last year, stocks are vulnerable to another significant decline this year. Stocks are overvalued, and Wall Street earnings expectations seem unrealistic. While leading indicators point to a recession this year, Wall Street analysts forecast corporate profits to grow by 12.5% this year. This growth estimate seems exceedingly unlikely since profit margins are near a record high and vulnerable as interest rates rise and growth slows, and S&P 500 earnings typically decline by about 20% in a recession.
Stocks are in a bear market, and we estimate that the economy will enter a mild recession this year. In this challenging economic environment, we expect safe havens (gold and long-term U.S. treasury bonds), defensive stocks (healthcare, utilities, and consumer staples), and high-quality bonds to perform well.
MARKET REVIEW:
2022 was a difficult and challenging year. Stocks and bonds performed poorly because the Fed aggressively raised interest rates to slow economic growth and fight inflation, which reached a forty-year high. The sharply higher interest rates pushed down the valuations of all financial asset classes. In fact, stocks and bonds declined for only the 5th time in the last 100 years. The S&P 500 fell 19.4% for the year, which was its worst year since the 2008 Great Financial Crisis, while the Bloomberg U.S. Aggregate bond index dropped 13% -- its worst year on record. The stock and bond markets poor performance led to the 60/40 balanced portfolio's worst return since the Great Depression.
Source: A Wealth of Common Sense
2022 was a bad year for investors because the Fed's monetary mistakes created asset bubbles which deflated once interest rates rose sharply. To support the economy and financial markets during the pandemic, the Fed set interest rates at 0%. The artificial level of interest rates coupled with the Fed's printing $120 billion each month to buy Treasury and mortgage bonds drove stock, bonds, and the housing market into an asset bubble. The bubble continued to grow because the Fed refused to remove its emergency measures despite a stout economic recovery and rising inflation.
In March, inflation reached 8.6%, so the Fed terminated its QE bond buying program and raised short-term interest rates to 0.25%. By early summer, the Fed realized inflation was not "transitory" and increased interest rates at the most aggressive pace since 1981. In nine months (from March to December), the Fed raised short-term interest rates from 0.00% to 4.50%, which drove all financial assets (stocks, bonds, and crypto) significantly lower.
Despite strong economic growth and inflation at a 40-year high, the Fed failed to remove its emergency monetary measures because it incorrectly believed that inflation was "transitory."
Source: Fred
By the summer, the Fed realized its mistake and aggressively raised short-term interest rates, which led to a bear market in financial assets.
Source: Fred
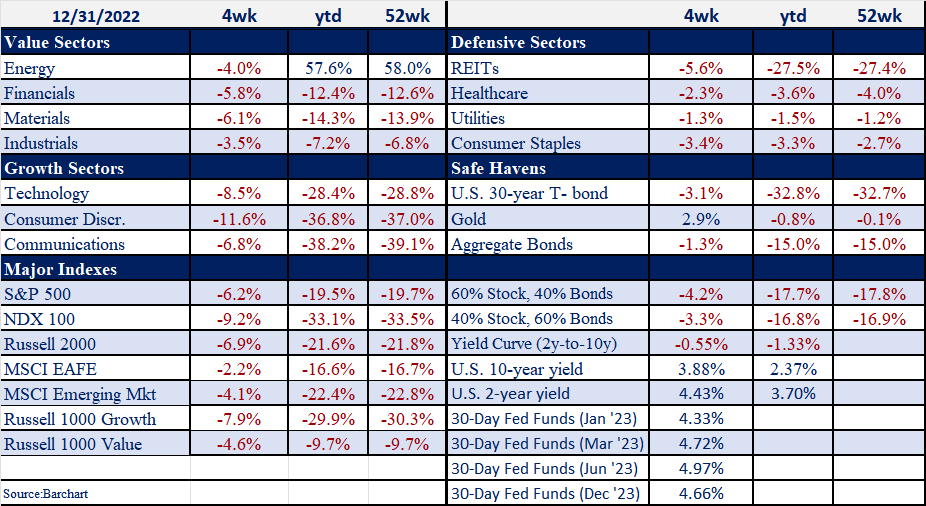
In this difficult investing environment, Energy was the only positive sector of the S&P 500. The Russell Growth sector fell by 29.9%, while the Russell Value sector declined by only 9.7%, which was the value sector's second-largest outperformance since 1979. According to S&P, the technology sector's 28.4% decline accounted for nearly 44% of the S&P 500's decrease in 2022.
While our model portfolio outperformed our 60/40 benchmark in 2022, we are disappointed by our portfolio's loss. We were defensively positioned in 2022, and in hindsight, we were invested in the strongest sectors of the market – Energy, value, and the defensive sectors of the market, gold, commodities, and Treasury Inflation-Protected Securities (TIPS). Unfortunately, there was no place to hide -- even gold (the ultimate safe haven) had a negative year.
FINANCIAL MARKET PERFORMANCE
ECONOMIC OUTLOOK:
The stock market started 2023 on a strong note. The S&P 500 and Nasdaq 100 have appreciated by 4.6% and 8.0%, respectively. The S&P 500 has rallied 15% off its October low, which is consistent with previous mid-term election rallies. The strong mid-term rally – which we wrote extensively about this summer and early fall – is due to technical factors (oversold market, excessive investor pessimism, passive 401k flows, corporate buybacks, and systematic trend-following strategies) and not a change in the fundamentals. We believe that we are still in a bear market. The first leg down was due to sharply higher interest rates and their negative impact on asset valuations. While higher interest rates negatively impacted financial assets in 2022, we think they will adversely affect the economy and corporate profits in 2023.
To justify the mid-term election rally, Wall Street has crafted a narrative that inflation has peaked, the Fed is poised to end its tightening cycle, and a soft economic landing is probable because China is reopening from its Covid lockdown, and Europe avoided an energy crisis because of a warm winter.
Instead of crafting optimistic narratives or focusing on lagging indicators (inflation and employment) like the Fed, we utilize market history, leading indicators of the economy, and market-based tools to determine the likely path of the economy (growth and inflation) and corporate profits.
Market history does not point to a soft economic landing this year. Most Fed tightening cycles led to recession, and since 1960, a recession has occurred every time inflation breached 5%. In fact, most Fed tightening cycles end in crisis because the Fed focuses on lagging economic indicators (inflation and employment) and ignores the money supply and other leading economic indicators.
Most Fed tightening cycles led to a recession. Since 1965, every time inflation rose above 5%, a recession occurred.
Source: Fred
Historically, to fight inflation, the Fed tightens until something breaks. This isn't surprising since the Fed focuses on lagging economic indicators (inflation and employment) and ignores the money supply and other leading economic indicators.
Last year, market-based indicators and the money supply indicated the economy was strong, and inflation would be a problem. Unfortunately, the Fed ignored these indicators and continued its unprecedented monetary stimulus, which created asset bubbles, and drove inflation to a 40-year high. We believe that the Fed is making another monetary mistake by focusing on inflation and employment measures – which are lagging economic indicators – and again ignoring the message from the money supply and leading economic indicators. The yield curve, the housing market, the ISM manufacturing survey and the Conference Board Leading Economic Index indicate that a recession is likely this year. Also, the plunging money supply growth rate shows that inflation has peaked and should decline to an acceptable level.
The yield curve's slope is probably the most accurate economic indicator. Every post-WWII recession has been preceded by an inverted yield curve (short-term interest rates yield more than long-term interest rates). The yield curve has been inverted since July and is the most inverted since 1981. Since the yield curve typically inverts 12 months before a recession, a recession is likely to occur this summer.
Source: FRED
The housing sector is a critical engine of economic growth. Higher mortgage rates led to a 30% plunge in building permits over the past year. A sharp decline in building permits typically presages an economic slowdown or recession.
Source: FRED
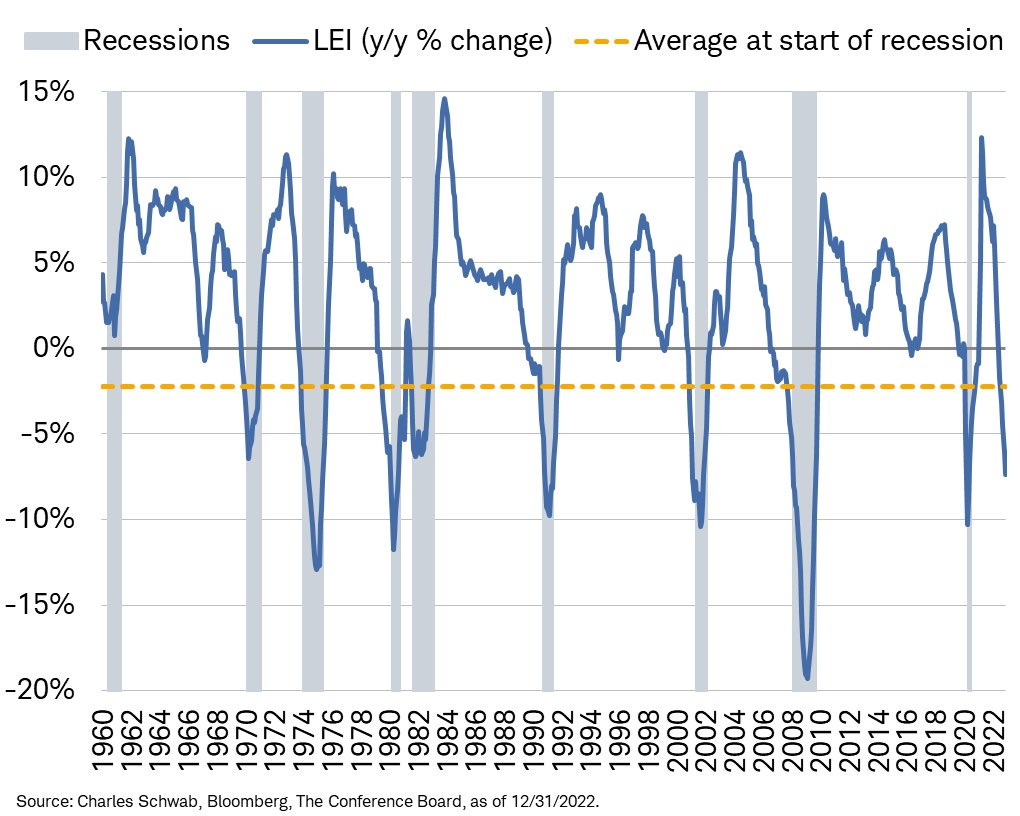
Another accurate indicator of the economy is the Conference Board's Leading Economic Index. The LEI has declined for eight consecutive months and is currently forecasting a recession. According to famed economist David Rosenburg, the LEI has had a perfect record of forecasting recessions since 1959.
Source: Charles Schwab
Milton Freidman famously said:" inflation is always and everywhere a monetary phenomenon." Last year, the Fed ignored the surging money supply, and inflation rose to a 40-year high. Today, the money supply's growth rate has collapsed, and inflation is poised to fall to an acceptable level later this year.
Source: Fred
While the leading economic indicators show a recession is likely this year, credit spreads indicate it will likely be a mild recession. Elevated credit spreads indicate stress in the corporate bond market and usually portend a credit crisis – i.e., the inability of corporations and individuals to borrow or roll over their existing debt. Currently, high-yield credit spreads (the yield difference between high-yield bonds and the U.S. 10-year Treasury bond) indicate that a credit event is unlikely. While high yield spreads have increased by 0.9% over the past twelve months, they remain below their long-term median level of 4.8%. We will closely monitor the credit markets for signs that the mild recession could turn into a credit crisis.
Credit spreads are a critical market-based indicator that signals problems in the debt markets that can lead to a credit crisis. While credit spreads have risen over the past 12 months, they remain below their long-term median level, which indicates that a recession should not spread to a credit crisis.
Source: FRED
FINANCIAL MARKET OUTLOOK:
We believe that the bear market's first leg – driven by higher interest rates and declining valuations – ended in October. Currently, stocks are in a seasonal countertrend rally which started near the mid-term election and should end this month. This year, we believe stocks will breach their October low as the economy falters and corporate profits decline. While stocks will struggle, we expect U.S. Treasury bonds and gold to perform well as we enter a recessionary economic environment. We expect a mild recession because the credit markets indicate there is no stress in the important corporate funding markets.
Despite a 27.5% decline last year, the stock market remains overvalued, especially compared to short-term U.S. Treasury bills that yield close to 5%. Based on long-term valuation measures (market cap to GDP and Shiller's CAPE), stocks are historically overvalued and vulnerable as profit margins regress to the mean and corporate profits disappoint.
In addition to high valuations, we estimate that stocks are especially vulnerable this year because Wall Street analysts are far too optimistic about the economy's strength. As discussed previously, most leading indicators of the economy estimate that a mild recession is likely in 2023. Typically, S&P 500 earnings decline by about 20% during a recession. According to S&P Global, Wall Street analysts forecast corporate profits to grow by 12.5% this year. This growth estimate seems exceedingly unlikely since profit margins are near a record high and vulnerable as interest rates rise and growth slows.
Market Value to GDP -- Still, it is probably the best single measure of where valuations stand at any given moment." –Warren Buffett, December 10, 2001. Based on market value to GDP, stocks have never been more expensive.
Shiller's CAPE (a valuation measure that smooths out cyclical earnings fluctuations) indicates that stocks are at a historic level of overvaluation despite the vicious bear market last year.
Source: multpl.com
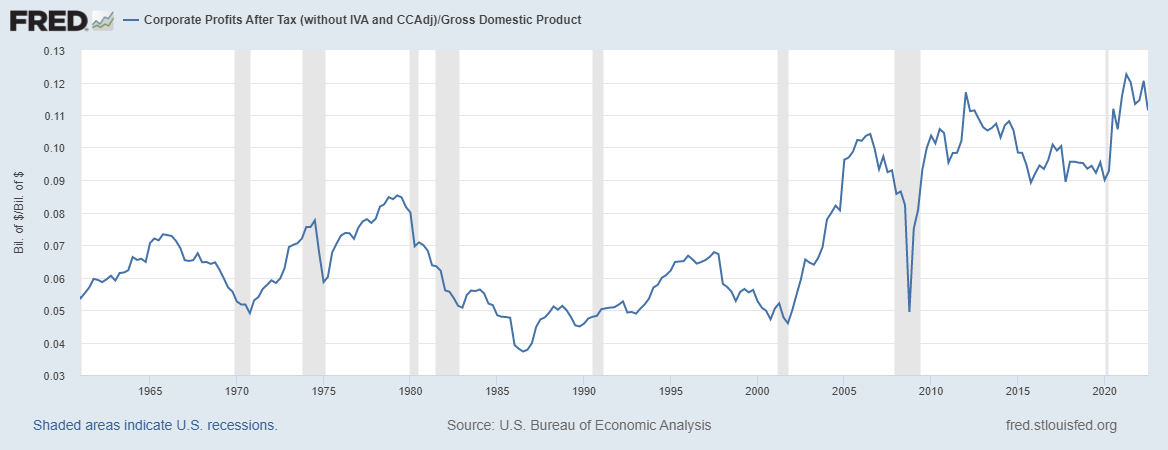
Corporate profits are 11.1% of GDP, which is about two standard deviations above its 60-year average of 7.2%. Profit margins are highly mean reverting and vulnerable as interest rates rise and growth slows.
Source: FRED
Our Model Portfolio:
The benchmark for our model portfolio is the Traditional Blend — 60% equity and 40% bonds. Our goal is to outperform the benchmark with less risk. To outperform, our investment portfolio is diversified and economically balanced. We eliminate laggards and tilt the portfolio toward our location in the business cycle. Finally, to manage risk, we volatility-weight our positions and set a volatility target equal to our benchmark's historic risk level. When volatility increases, our asset allocation dynamically reduces our equity risk exposure.
This year we performed well relative to our 60/40 benchmark because of our defensive investment posture, which was underweight stocks and invested in the market's defensive sectors (healthcare, consumer staples, utilities). Also, our investments in gold, energy stocks, commodities, and TIPs (Treasury Inflationary Protected Securities) helped us perform well in the stagflationary economic environment of elevated inflation and slowing growth.
Since very few asset classes (energy stocks, oil, and the U.S. dollar) appreciated in 2022, it was a challenging investing environment. Leading indicators show that inflation is declining, and the economy will likely enter a mild recession this year. In this recessionary environment, we expect the safe havens (gold and long-term U.S. treasury bonds), defensive stocks (healthcare, utilities, and consumer staples), and high-quality bonds to perform well. In contrast, growth and economically sensitive stocks, commodities, and lower credit-quality bonds will perform poorly.
Our portfolio is mainly positioned for a recessionary environment; only energy stocks and the Goldman Sachs commodity index remain from our Stagflation portfolio. We have focused our fixed-income exposure on shorter-term U.S. Treasury notes (two years and less) because they have a high risk-free yield and will provide capital gains if we enter a recession next year. While we expect 2023 to be a challenging year for the economy, we see many opportunities to generate a solid positive return.
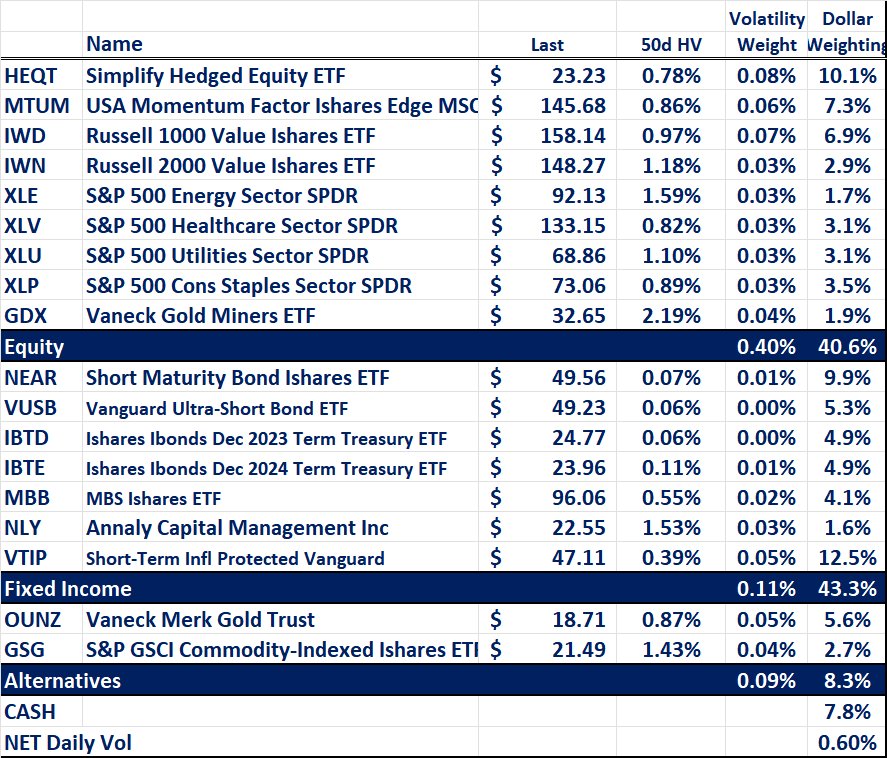
Current Risk-Weighted Model Portfolio:
Our portfolio's risk level (annualized volatility) is 9.6%, which is less than our 60\40 benchmark's risk level of 13.8%.
In Sum:
The first leg of the bear market was due to rising interest rates and their negative impact on the value of financial assets. We believe the next leg down for stocks will be driven by a weak economy and declining profits. While economically sensitive stocks will suffer, we think that U.S. Treasury bonds, gold, and the defensive sectors of the S&P 500 (healthcare, consumer staples, and utilities) will perform well in this recessionary economic environment.
The stock market has rallied sharply since its mid-term election low. While bulls believe that the stout equity rally signals a fundamental improvement, we think the rally is technically driven (an oversold market, passive 401k contributions, corporate buybacks, and systematic trend-following trading strategies). Instead of passive and speculative flows pushing the market higher, we believe the recessionary environment will lead to disappointing earnings and poor equity returns.
The market's downside is predicated on the depth of the recession and how far earnings decline, which will be driven by the Fed's monetary policy and the corporate credit markets. Our base case for next year is that a mild recession leads to a 10% earnings decline. In this environment, the S&P 500 could fall to 3000 – a 16.5 P/E multiple on earnings of $180. In our view, the bear market will end when stocks are cheap, the economy is in recession, the Fed is cutting interest rates, and investors are pessimistic.
Thank you for reading The Manley Market Memo.
Subscribe for free to receive new posts and support our work. Also, this post is public, so please feel free to share it. And we appreciate any likes!
Disclaimer: The material in this newsletter is for educational purposes only and should not be considered investment advice or a recommendation of any particular security, strategy or investment product. This newsletter is not a substitute for professional investment services. Past performance is no guarantee of future results, and there is no assurance that investment objectives will be achieved. Information contained herein has been obtained from sources believed to be reliable but not guaranteed. All investments contain risk.


How about crypto bro which month is going to be bad for the market in general ?
when we can expect a low?